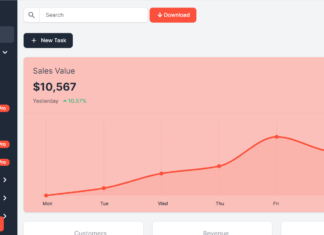
Zend Developer Zone have an interesting article about building dashboard with PHP and Flex written by Jack Herrington. In this article Jack explores – using a combinations of different technologies including PHP, Flex, ILOG Elixir, AMFPHP, and FlexLib – the possibility to create an advanced 3D interactive graph to show your website traffic.

Let’s face it: Interactive graphs and dashboards have never been easy to put together on the web. Sure, there are graphing libraries out there for PHP, but to get something that looks really good and that a user can play with has been tough. Or at least, it was yesterday. Today, I show how to use a combination of PHP for the back end and Adobe Flex for the front end that will put interactive 3D within your grasp. Right now.


