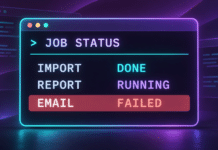





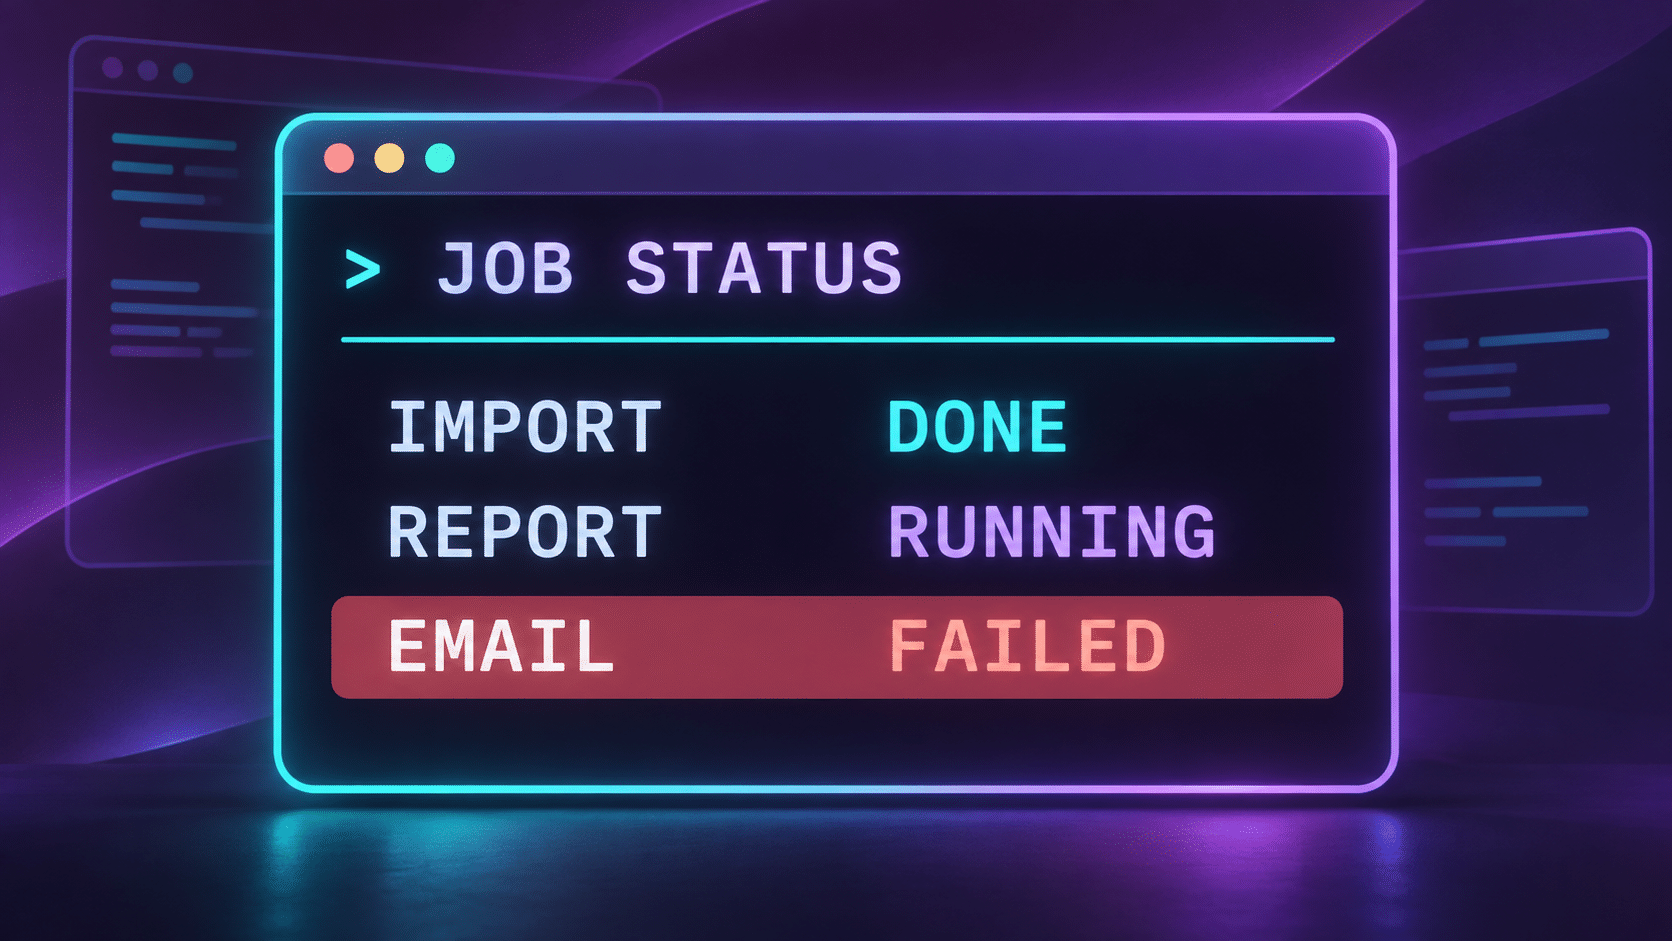
At 8:07, the morning import has accepted 214 records and rejected three. The monthly report is still running. The email job has failed after a second attempt. All three updates are in the terminal, somewhere between connection messages and debug output. The developer on call has one question: what needs attention now?
Logs can tell you what happened and in what order. Answering the developer’s question requires a different view of the same work. An import that finished with rejected records may need a follow-up. A report that has been running for two minutes may be fine. An email job that just failed may matter more than either. A useful dashboard puts those states together and lets the operator decide where to look first.
That is the problem we are taking to PHP TUI in the first installment of PHP Project Radar. The project grew out of a PHP port of Ratatui, a Rust library for terminal interfaces. It provides widgets for tables, lists, gauges, charts, and tabs, plus layout tools for fitting those pieces into a terminal window. If the application and its operational commands already live in PHP, the dashboard can use the same language and application services.

Decide what the first screen needs to say
Start with a list of jobs and the latest meaningful state for each one. The screen should tell you which job failed, which one is still running, and what a completed job actually accomplished. The difference between DONE and 214 accepted, 3 rejected matters. The first describes the execution. The second tells the operator that three records may still need attention.
The same distinction applies to progress. A gauge makes sense when the application knows how much work there is and how much it has completed. If the reporting job has no reliable total, show its current phase or the time of its last update. A progress bar that sits at 80 percent while the process waits on a remote service gives the operator very little to act on.
Draw a dashboard with three sample jobs
Install the package with Composer in a new directory. The first version draws a single frame using fixed data. That keeps the layout easy to change while you work out what belongs on screen.
composer require php-tui/php-tuiSave the following as jobs.php and run php jobs.php in a terminal. DisplayBuilder creates the display, and ParagraphWidget renders the text we pass to it.
<?php

declare(strict_types=1);

use PhpTui\Tui\DisplayBuilder;
use PhpTui\Tui\Extension\Core\Widget\ParagraphWidget;
use PhpTui\Tui\Text\Text;

require __DIR__ . '/vendor/autoload.php';

$jobs = [
    ['Import', 'DONE', '214 accepted, 3 rejected'],
    ['Report', 'RUNNING', 'Rendering monthly summary'],
    ['Email', 'FAILED', 'Provider timed out on attempt 2'],
];

$lines = ['JOB STATUS', ''];

foreach ($jobs as [$name, $status, $detail]) {
    $lines[] = sprintf('%-8s %-8s %s', $name, $status, $detail);
}

$display = DisplayBuilder::default()->build();
$display->clear();
$display->draw(
    ParagraphWidget::fromText(
        Text::fromString(implode("\n", $lines))
    )
);
The example keeps the three rows in a single widget. That is enough to answer a few design questions. Can you read the status at a glance? Does the screen still make sense without color? What gets cut off when you split the terminal window? The padded strings also have a limit. If job names can contain accented text, wide characters, or user-supplied labels, test how those names align on screen before relying on fixed-width formatting.
Give the overview and the details different jobs
The overview should stay short even when the last error is long. In a wider terminal, put the job list on the left and the selected job on the right. The detail panel can show the last attempt, the time it started, and a short explanation of the failure. In a narrow terminal, keep the list visible and let the operator open the detail view with Enter.
PHP TUI’s event guide shows how to read key events through the PHP-Term terminal object. For a first interactive version, up and down can move the selection, Enter can open the details, and Escape can return to the overview. Store the selected job’s ID. If a new failure moves to the top during a refresh, the operator should keep looking at the job they chose. If that job has disappeared, return to the list and explain what changed.
Make stale data visible
Once the dashboard starts reading live data, the most important timestamp may be the time of the last successful refresh. Imagine the report is still labelled RUNNING when the connection to the database drops. The application might have finished the report, but the dashboard has lost the ability to tell. Keep the last good snapshot visible, mark it as stale, and show when it was collected. The operator can then distinguish an old observation from a current state.
Keep the data fetch separate from rendering. A key press should move the selection without asking the database for another snapshot. Start with a manual refresh and a timestamp. If operators need automatic updates, add polling on a separate interval and put a timeout on each request. Test what happens when the database is slow, unavailable, or temporarily returns an empty list. Each condition tells the operator something different.
An inspection tool can earn its place before it can retry a job
An email timeout is a good example of why inspection comes first. The provider may have accepted the email before the connection timed out. From the worker’s perspective, the outcome is uncertain. A retry button would turn that uncertainty into an operational decision. If you add one, show the job ID and the last known result, then call the same retry service your application already uses. The dashboard can display whether the service accepted the request and refresh when the next attempt becomes visible.
There is also a smaller detail that affects whether people trust the tool. If an interactive version changes terminal settings or switches to an alternate screen, restore the original settings on exit. Test the normal quit key, Ctrl+C, and a failed refresh. A useful dashboard should leave the shell ready for the operator’s next command.
The Radar verdict
I would try PHP TUI on a workflow that already has an operator in the terminal. Import monitoring, a queue inspector, and a deployment checklist are good candidates because each gives the person watching a next action. For a scheduled task or a command used in shell pipelines, I would keep the existing text or JSON output available. For a shared tool, I would check the terminal environments the team uses, especially on Windows, which the project README flags as a limitation.
Give someone the dashboard while an import is running and ask them to find the first job that needs attention. Then ask them to find the same information in the logs. Watch where they hesitate and what they open next. That will tell you whether the next feature should be a detail panel, a better status label, or simply a link back to the relevant log entry.
PHP TUI on GitHub · Documentation and official demo · Keyboard and terminal events · Composer package