Are you struggling with slow response times or high resource usage in your PHP application? And looking for quick solution to check what’s wrong without changing your application, and with minimal overhead ? These are common problems that can have a significant impact on the user experience and overall performance of your application. Fortunately, there are many tools available to help you diagnose and fix these issues.
In this comprehensive guide, we will explore one such tool: PHPSpy. PHPSpy is an open-source profiling tool for PHP applications that allows developers to quickly identify and diagnose performance issues. It works by monitoring the execution of PHP code and generating a detailed report that highlights areas of the code that can be optimized.
We will show you how to use PHPSpy to tackle real-world performance issues that can affect the user experience of your PHP application. We will cover the following topics:
- Installing and configuring PHPSpy
- Profiling your PHP code with PHPSpy
- Analyzing PHPSpy reports to identify performance issues
- Optimizing your PHP code based on PHPSpy recommendations
- Advanced features of PHPSpy for even more detailed performance analysis
Whether you’re dealing with slow database queries, inefficient algorithms, or memory leaks, PHPSpy can help you pinpoint the root cause of the problem and optimize your code for maximum performance. By the end of this guide, you will have a solid understanding of how to use PHPSpy to improve the performance of your PHP application and deliver a better user experience. Let’s get started!
PHPSpy Features
PHPSpy works by monitoring the execution of PHP code and generating detailed reports that highlight areas of the code that can be optimized. Some of the key features of PHPSpy include:
- Profiling at the function level: PHPSpy allows you to profile your code at the function level, giving you a granular view of your application’s performance.
- Detailed reports: PHPSpy generates detailed reports that show you how much time your code spends in each function and how many times each function is called.
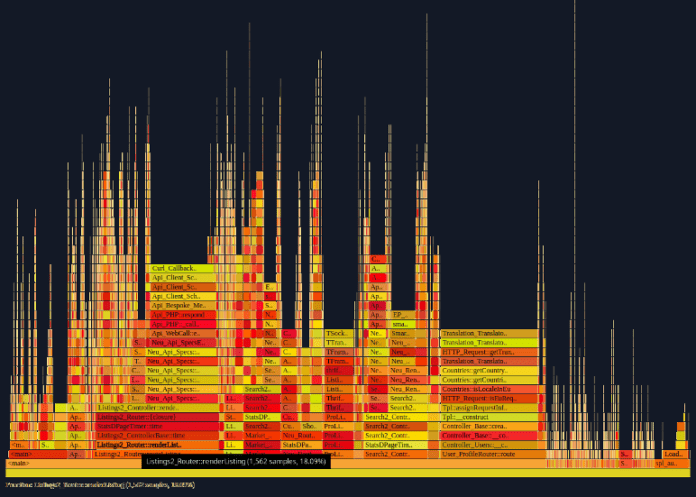
- Flame graphs: PHPSpy generates flame graphs that visualize the performance of your code, making it easy to identify bottlenecks and hotspots.
- Integration with other tools: PHPSpy can be integrated with other tools commonly used in PHP development, such as Xdebug and Blackfire.
Installing PHPSpy
a. System requirements
PHPSpy works with non-ZTS PHP 7.0+ with CLI, Apache, and FPM SAPIs on 64-bit Linux 3.2+. So any linux or Mac could be fine.
b. Installing PHPSpy
To install PHPSpy manually, you can download the source code from the official GitHub repository and then compile it:
git clone https://github.com/adsr/phpspy.git
cd phpspy
make
This will create an executable binary file named phpspy in the current directory.
Once PHPSpy is installed, you can start profiling your PHP applications.
Profiling with PHPSpy
a. Understanding how profiling works
Profiling is the process of analyzing an application’s runtime behavior to identify performance bottlenecks, memory leaks, and other issues that may impact its performance. Profiling allows developers to identify and optimize code that is causing slowdowns, memory usage, or other issues.
PHPSpy works by attaching to a running PHP process and periodically collecting stack traces of all running threads. It then aggregates the collected data and generates a report, showing the time spent in each function or method call.
b. Configuring PHPSpy for profiling
Before you can start profiling with PHPSpy, you need to configure it to work with your PHP environment. This involves specifying the PHP binary path, choosing the sampling rate, and defining the output file.
You can configure PHPSpy by creating a configuration file or by using command-line arguments. PHPSpy supports several command-line options, such as the sampling rate, the output file, and the PID of the process to attach to.
c. Running a profiling session
here are some examples of running a profiling session with PHPSpy:
- To profile a PHP script using PHPSpy, run the following command:
sudo ./phpspy -e 'p@/path/to/script.php' -p $(pgrep -n httpd) -i 5 -o /tmp/output.logThis will start profiling the script at /path/to/script.php with a 5-second sampling interval, and output the results to /tmp/output.log. To explain this command in detail :
-e 'p@/path/to/script.php': This option tells PHPSpy to trace all function calls and line-by-line execution of a specific PHP script at/path/to/script.php. Thepprefix stands for “profile”, which means that PHPSpy will collect detailed profiling information.-p $(pgrep -n httpd): This option tells PHPSpy to attach to the Apache process with the PID returned bypgrep -n httpd. This assumes that the web server is running under the Apache process and that there is only one Apache process running on the system.-i 5: This option tells PHPSpy to collect profiling data for 5 seconds before stopping the tracing.-o /tmp/output.log: This option tells PHPSpy to write the collected profiling data to the file/tmp/output.log.
- To profile an entire PHP application running on Apache, run the following command:
sudo ./phpspy -p $(pgrep -n httpd) -i 5 -o /tmp/output.logThis will profile all PHP scripts running under Apache with a 5-second sampling interval, and output the results to /tmp/output.log.
An interesting feature is to peek at a variable value during execution. To do so, you would need to use the -e flag to specify the script and line number to peek at, and use the varpeek command in the output to display the value of the variable at that point in the script.
sudo ./phpspy -e 'i@/var/www/test/lib/test.php:12' -p $(pgrep -n httpd) | grep varpeekThis command will look for the Apache process with the lowest PID (-n option) and attach PHPSpy to it. It will then wait for the specified script (/var/www/test/lib/test.php) to be executed up to line 12 (-e 'i@/var/www/test/lib/test.php:12'). Once the script reaches that line, PHPSpy will output the value of any variables that are currently in scope at that point, which can be filtered using the grep command with the varpeek keyword.
- To profile a PHP script running in CLI mode, run the following command:
sudo ./phpspy -- php /path/to/script.phpThis will profile the script at /path/to/script.php running in CLI mode, and output the results to the console.
- To profile a PHP script using a specific version of PHP, run the following command:
sudo ./phpspy -V73 -e 'p@/path/to/script.php' -p $(pgrep -n httpd) -i 5 -o /tmp/output.logThis will use PHP 7.3 to profile the script at /path/to/script.php with a 5-second sampling interval, and output the results to /tmp/output.log.
These are just some examples of how to run a profiling session with PHPSpy. You can customize the options and parameters according to your specific use case.
Analyzing PHPSpy Profiling Results
a. Understanding the profiling output
The profiling output of PHPSpy shows information on the functions and methods that are being executed in your PHP application, along with the total number of calls and the amount of time spent in each function/method. You can also view the call tree of your application, which shows the hierarchical structure of your code and how much time is being spent in each function/method.
b. Identifying bottlenecks and performance issues
By analyzing the profiling output, you can identify which functions/methods are taking the most time and causing performance issues in your application. You can also use the call tree to see which functions/methods are being called the most and which functions/methods are calling them.
c. Improving performance using PHPSpy profiling data
With the information gathered from the profiling output, you can make changes to your code to improve performance. This could involve optimizing certain functions/methods, reducing the number of calls to certain functions/methods, or restructuring your code to reduce the overall number of function/method calls.
Tips for Optimizing PHP Performance with PHPSpy
a. Best practices for optimizing PHP applications
We’ll talk about optimizing PHP applications in detail in future articles, but keeping these tips in mind will save you a lot of time and headaches. One of the best ways to improve PHP application performance is to reduce the number of database queries and HTTP requests. This can be achieved by caching data, using indexes to speed up queries, and combining files to reduce HTTP requests. You should also minimize the use of complex data structures, loops, and conditionals as these can cause your application to run slower.
Another important consideration is to ensure that your PHP code is properly optimized. This means removing unnecessary code, using appropriate data types, and avoiding using too many global variables. Additionally, it’s a good idea to use the latest version of PHP and enable opcode caching, as this can significantly improve performance. Finally, make sure to test your application thoroughly and monitor its performance over time to identify and fix any issues that arise. By following these best practices and using PHPSpy to identify and fix performance issues, you can ensure that your PHP application runs smoothly and efficiently.
b. Using PHPSpy to identify and fix performance issues
- Analyzing PHPSpy profiling results to identify bottlenecks:
After running a profiling session with PHPSpy, you can analyze the output to identify the slowest and most frequently called functions. This information can help you prioritize your optimization efforts and focus on the parts of your code that are causing the most performance issues.
1- First, run PHPSpy with the following command to profile your PHP application:
sudo ./phpspy -p <PID>Replace <PID> with the process ID of your PHP application.
2- Let PHPSpy run for a while and gather profiling data.
3- Stop PHPSpy by pressing Ctrl-C.
4- PHPSpy will output the profiling data to the console. Look for the functions or methods that have the highest µs value. These are the functions or methods that take the most time to execute.For example, you might see something like this in the output:
Total: 10ms
syscall            count     ns/call    %tot     %sys     %usr
...
my_slow_function   50        200000     50.0     10.0     40.0
my_fast_function   1000      500        50.0     20.0     30.0
...
In this example, my_slow_function takes 50% of the total time and has an average execution time of 200,000 nanoseconds per call, while my_fast_function takes 50% of the total time and has an average execution time of 500 nanoseconds per call.
5- Analyze the code that is executed inside the slow functions or methods. Look for any unnecessary or redundant code that can be removed or optimized.
6- Make the necessary code changes to optimize the slow functions or methods.
7- Repeat steps 1-6 until you have identified and optimized all the bottlenecks in your PHP application.
- Finding memory leaks and inefficiencies:
PHPSpy can also be used to identify memory leaks and other inefficiencies in your code. By profiling your code and analyzing the output, you can identify areas where memory is being consumed unnecessarily or where your code is not optimized for performance.
One way to find memory leaks and inefficiencies using PHPSpy is to monitor the memory usage of a PHP process over time. To do this, you can use the -m option to enable memory profiling.
For example, to monitor the memory usage of a PHP script running under Apache, you can run the following command:
sudo ./phpspy -e 'i@/var/www/test/index.php' -p $(pgrep -n httpd) -m 10 -o /tmp/output.logThis will profile the script every 10 seconds and write the results to /tmp/output.log. You can then analyze the output to identify any memory leaks or inefficiencies.
One thing to look for is a steady increase in memory usage over time. If the memory usage continues to grow without ever leveling off or decreasing, it could be a sign of a memory leak. You can use the profiling data to identify which parts of the script are responsible for the memory growth and investigate further.
Another thing to look for is high memory usage during certain operations. For example, if a database query causes a sudden spike in memory usage, it could be a sign of inefficient memory usage. You can use the profiling data to identify which queries are causing the spikes and optimize them to reduce memory usage.
c. Monitoring performance over time with PHPSpy
Monitoring performance over time with PHPSpy involves setting up automated profiling and monitoring of your PHP application. This allows you to establish performance baselines and track changes over time, enabling you to identify performance issues before they impact users.
To set up automated profiling and monitoring with PHPSpy, you can create a script that periodically runs PHPSpy with the appropriate options and writes the output to a log file. You can then use a monitoring tool like Nagios or Zabbix to monitor the log file and alert you if performance falls below certain thresholds.
#!/bin/bash

while true; do
  timestamp=$(date +%Y-%m-%d_%H:%M:%S)
  output_file=/tmp/phpspy_$timestamp.log

  sudo ./phpspy -p $(pgrep -n httpd) -o $output_file

  sleep 300 # wait for 5 minutes
done
This script uses a while loop to run PHPSpy continuously. It gets the current date and time and uses it to create a unique filename for the output log file. It then runs PHPSpy with the appropriate options, including the process ID of the HTTP server obtained using pgrep. Finally, it waits for 5 minutes using the sleep command and then starts the loop again.
In addition to monitoring performance, you can also use PHPSpy to fine-tune server and PHP configurations over time. By analyzing profiling data, you can identify bottlenecks and performance issues and make changes to your server and PHP configurations to optimize performance. This can involve adjusting settings like memory limits, opcode cache size, and thread concurrency to better match the needs of your PHP application.
Conclusion
In this article, we explored phpspy, a tool that can help you identify performance bottlenecks in your PHP applications. We started by discussing why performance optimization is important, and why it can be challenging to do manually. Then, we introduced phpspy and explained how it works.
We showed you how to install phpspy on your system and use it to analyze the performance of your PHP applications. We also demonstrated how to interpret phpspy’s output and identify the functions that are causing performance issues. By using phpspy to optimize your PHP code, you can significantly improve the performance of your applications and provide a better experience for your users.
It is important to note that phpspy is not the only tool available for profiling PHP applications. There are many other profiling tools that you can use, such as Xdebug, Blackfire, and Tideways. However, we hope that you gained an understanding of the capabilities of such tools and how they can be used to identify and optimize performance issues in PHP applications. Depending on your specific use case and preferences, you may find that phpspy or another profiling tool is the best fit for your needs.
More information at https://github.com/adsr/phpspy


