


PHP SPX, Simple Profiling eXtension, is just another profiling extension for PHP, free, open source and bundled with a Web UI. SPX is totally free and confined to your infrastructure, nothing from your data is leaked to a SaaS or elsewhere.
The tool is very simple to setup, just set an environment variable (command line) or switch on a radio button (web page) to profile your script. You can then manually instrumenting your code, or using a dedicated browser extension or command line launcher.
PHP SPX is multi metrics capable: 22 are currently supported (various time & memory metrics, included files, objects in use, I/O…). However only two are collected by default : Wall time and Zend Engine memory usage.
One of its great features is that it’s able to collect data without losing context. For example Xhprof (and potentially its forks) aggregates data per caller / callee pairs, which implies the loss of the full call stack and forbids timeline or Flamegraph based analysis.
The Web UI allow you to enable / configure profiling for the current browser session, list profiled script reports, or select a report for in-depth analysis, featuring one of these interactive visualizations: timeline (scale to millions of function calls), flat profile, or Flamegraph.
Getting started with PHP SPX
Actually PHP SPX supports only Linux and Macosx with the zlib dev package, PHP 5.6 to 8.0 and Non-ZTS (threaded) build of PHP. So obviously you need the PHP dev package related to your current installation to build the extension :
sudo apt install zlib1g-dev
git clone https://github.com/NoiseByNorthwest/php-spx.git
cd php-spx
phpize
./configure
make
sudo make install
Then add extension=spx.so to your php.ini, or in a dedicated spx.ini file created within the include directory. You may also want to override default SPX configuration to be able to profile a web page with this one :
spx.http_enabled=1
spx.http_key="dev"
spx.http_ip_whitelist="127.0.0.1"
To access SPX WebUI, if your application is accessible via http://localhost, simply access the control panel via http://localhost/?SPX_KEY=dev&SPX_UI_URI=/
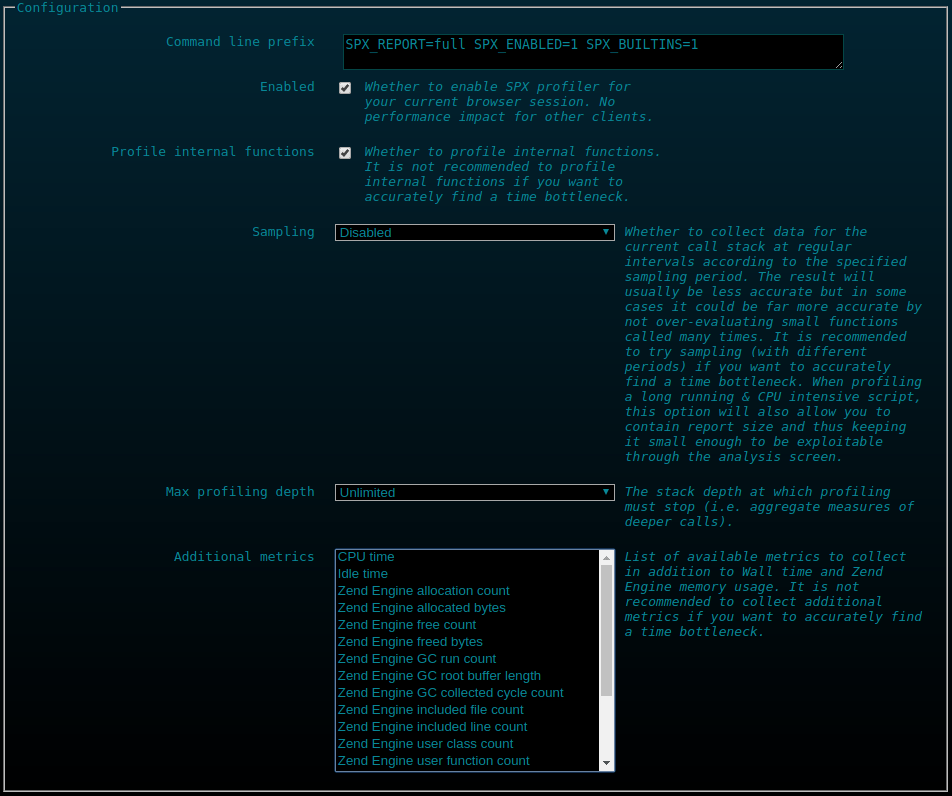
Then switch on “Enabled”. At this point profiling is enabled for the current domain and your current browser session through a set of dedicated cookies. Profiling can also be triggered with Curl as shown in this example:
curl --cookie "SPX_ENABLED=1; SPX_KEY=dev" http://localhost/Then refresh the web page you want to profile and refresh the control panel to see the generated report in the list below the control panel form. Finally click on the report in the list and enjoy the analysis screen.
Overall SPX is a very simple and powerful PHP Extension to help you profiling your PHP applications (Web or command line) easily with a simple configuration and a powerful web interface. It could be used also from command line with the same web features. However notice that SPX is still under development and not production ready due to the lack of review and feedback.
There are also some notes on accuracy in tracing mode. However, whatever the platform, if you want to maximize accuracy to find a time bottleneck, you should avoid profiling internal functions, avoid collecting additional metrics, try sampling mode with different sampling periods, and finally try to play with maximum depth parameter to stop profiling at a given depth.
PHP SPX is an open source software released under a GPL-3.0 License. More information at https://github.com/NoiseByNorthwest/php-spx


“So obviously you need the PHP dev package”
I guess it’s not obvious at all (otherwise, you wouldn’t need to explain it)
You are right Massimiliano, building and installing extensions usually for advanced users, I had to mention it because even advanced users sometimes forget it. So just apt install php-dev; or php7.4-dev, php7.2-dev if you want to install a different version than the latest php 8.